19 Jun REMPLAN Location Quotient Reports: New Insights into Industry Specialisation
Authored by Dylan Quinn-Valentine – Economist at REMPLAN – June 2024

REMPLAN Economy reports have expanded to include Location Quotients, a widely used approach for understanding local industry dynamics and areas of specialisation.
In REMPLAN, this addition provides a fresh perspective on how industries are concentrated and specialised down to small areas, and how these levels of specialisation are changing over time. This offers unique and valuable insights for economic developers, planners, policymakers, consultants and investors.
Understanding Location Quotients
Location Quotient (LQ) analysis is a method used to assess how concentrated a particular industry is in a region compared to a larger reference area, such as a state. By comparing local industry employment data to broader benchmarks, LQ analysis helps identify whether an industry is more, or less specialised in a given region.
How are Location Quotients Calculated?
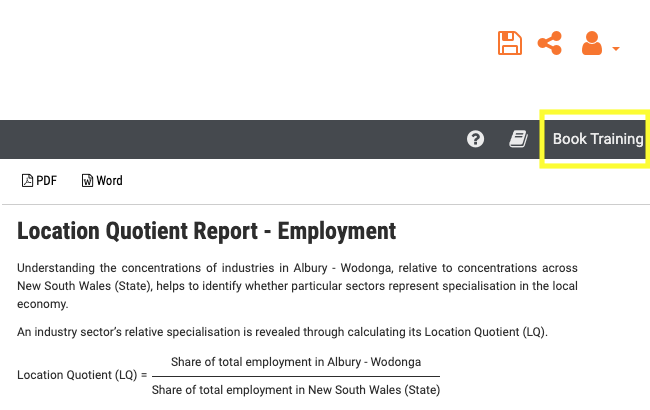
The formula for calculating Location Quotients is:
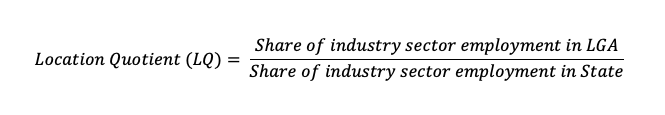
This simple yet insightful calculation provides a value that indicates the relative concentration of employment in an industry sector.
Interpreting Location Quotients
An LQ greater than 1 indicates that the industry is more concentrated in the local area compared to the State, suggesting a degree of industry specialisation.
An LQ less than 1 indicates a lower concentration, implying that the industry is less specialised locally than for the State.
An LQ of 1 represents equal concentration in the local economy and the State.
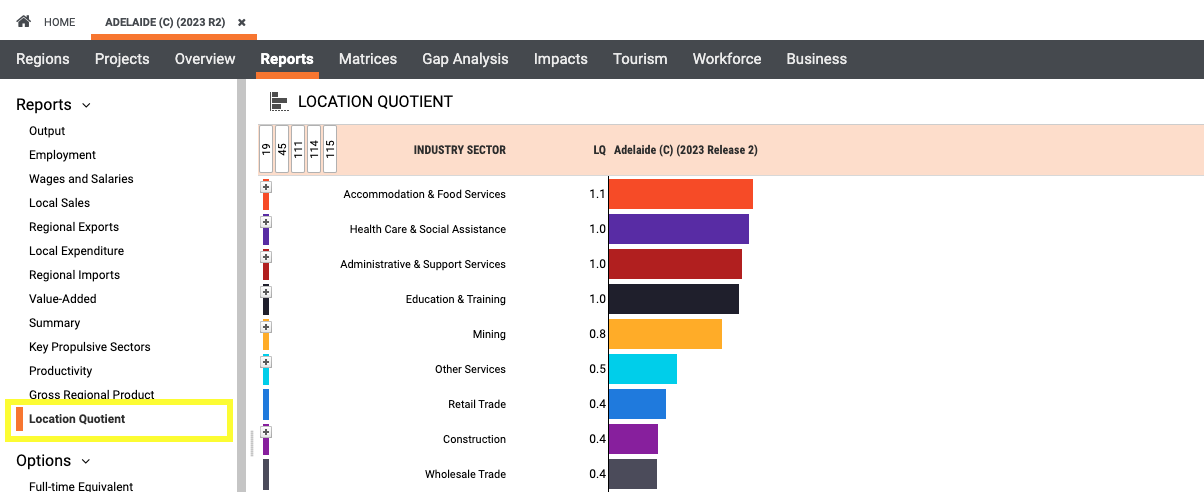
Figure 1 Adelaide LGA – Location Quotients
Applications of Location Quotient Analysis
LQ analysis is a powerful tool in economic development and planning:
Identifying Industry Concentration: Helps pinpoint areas with strong industry presence for targeted development and investment.
Evaluating Economic Strengths and Weaknesses: Provides insights into over-represented, or under-represented industries, aiding in the development of lower risk, balanced economies.
Workforce Development: Aligning education and training programs with local industry specialisations and needs.
Supporting Policy: Assists in crafting of targeted policies based on local economic structures and areas of specialisation.
Attracting Investment: Showcases regional strengths and local industry specialisations to potential investors, fostering economic growth and employment opportunities.
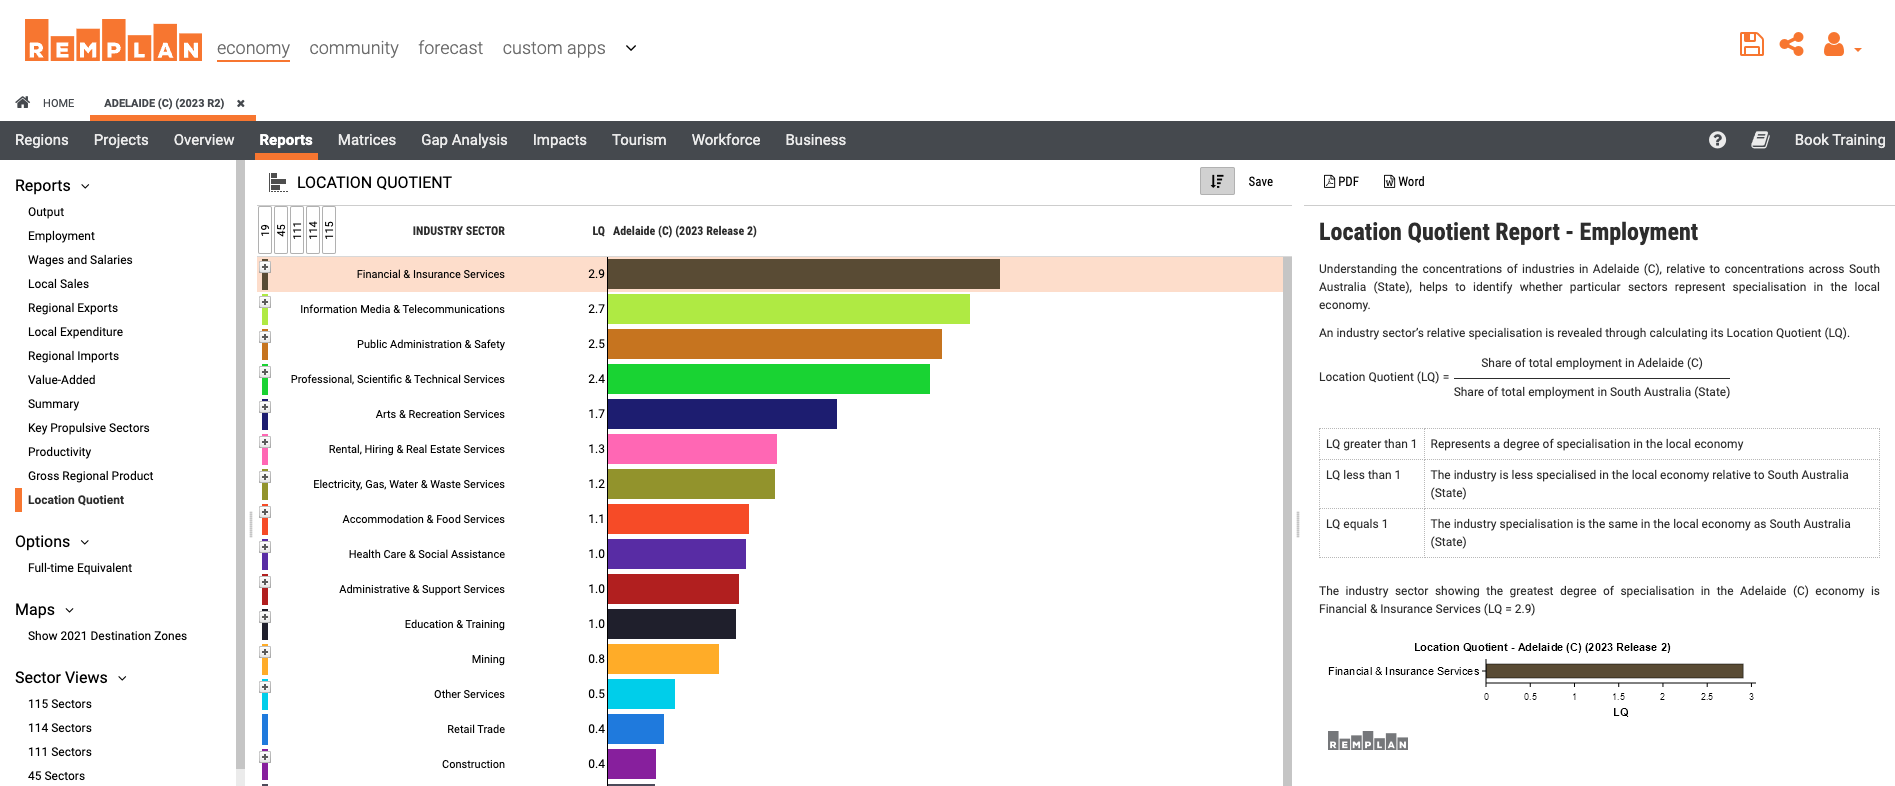
Case study – Adelaide
The LQ’s for the Adelaide Local Government Area (LGA) benchmarked against South Australia, reveal notable industry specialisations in:
- Financial & Insurance Services (LQ: 2.9)
- Information Media & Telecommunications (LQ: 2.8)
- Public Administration & Safety (LQ: 2.5).
Figure 1 Adelaide LGA – Industry Specialisations
Location Quotient Reporting – Key Features
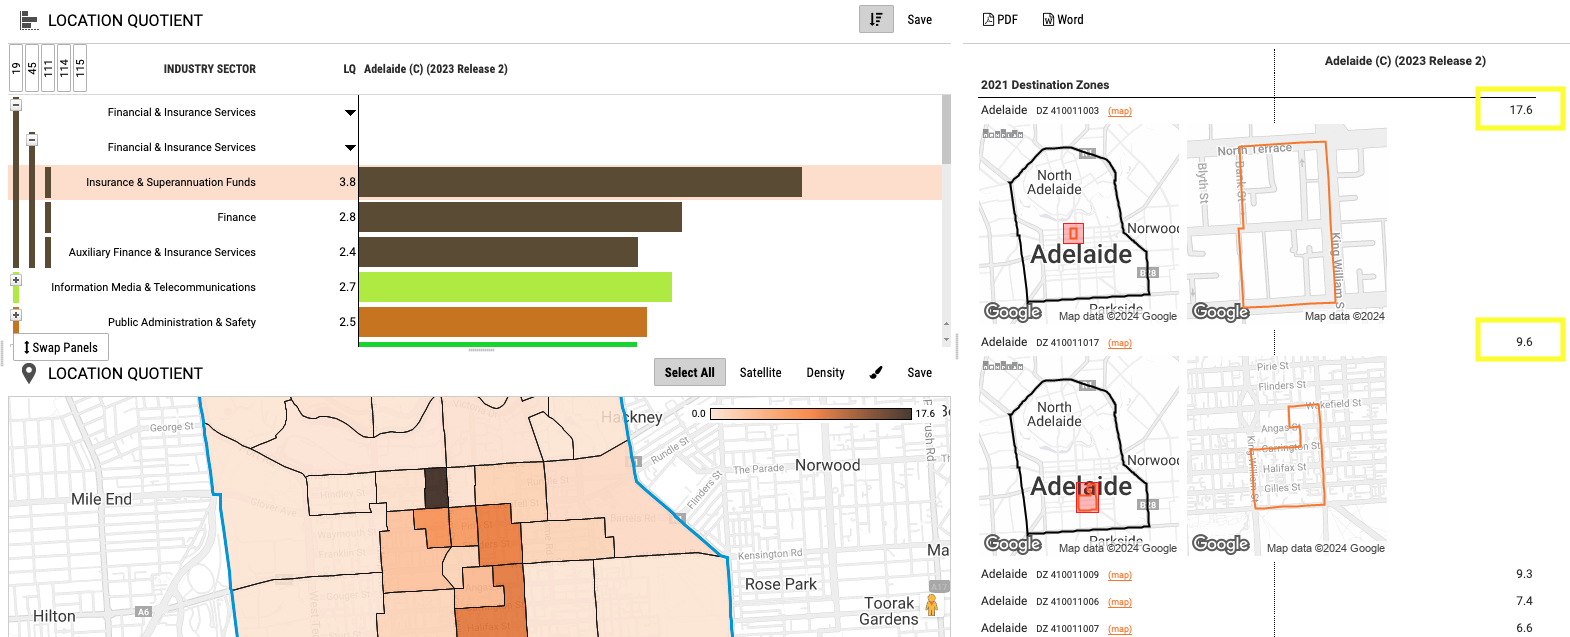
Small Area Insights: LQ data is presented at smaller geographic levels within a broader region, such as Destination Zones. This granularity helps identify high industry concentrations and specialisations at a small zone level, which broader area analysis might not reveal.
Figure 1 Adelaide LGA – ‘Insurance and Superannuation Funds – High Specialisation Zones
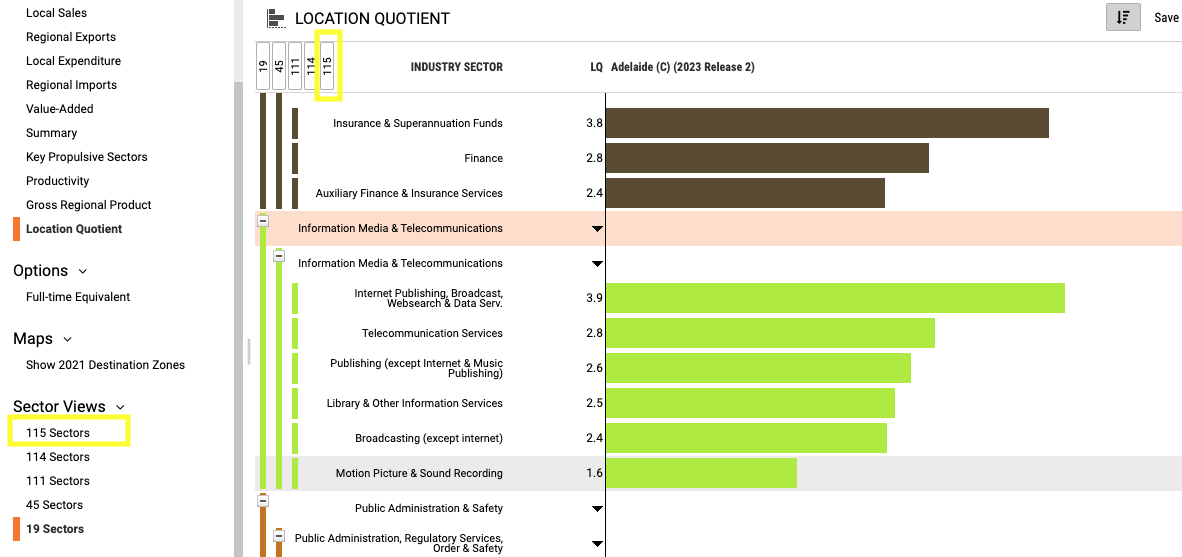
Detailed Industry Insights: Drill down to 115 specific industry sectors from the default 19 broad sectors, revealing more detailed insights into local industry specialisations.
Figure 4 Adelaide LGA – 115 Industry Sector LQs
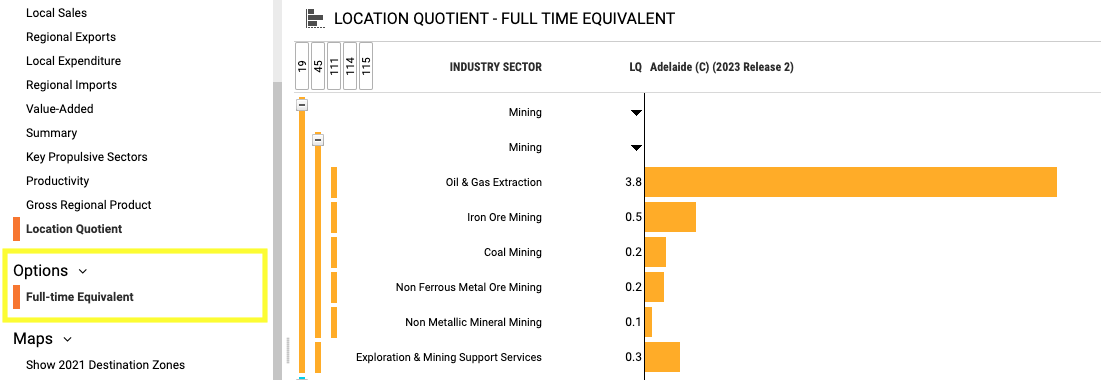
Full Time Equivalent (FTE) Conversion: This function adjusts employment figures to account for part-time and full-time work, giving a more nuanced picture of industry size, strength and specialisation.
Figure 5 Adelaide LGA – FTE Employment Based LQs
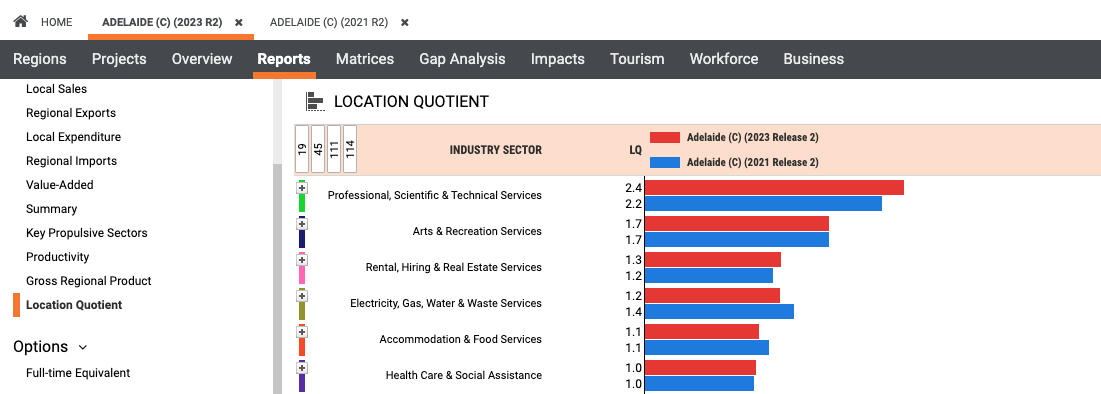
Historical Data Integration: Analysing historical data helps identify changes to local levels of industry specialisation over time.
Figure 6 Adelaide LGA – LQ Trends
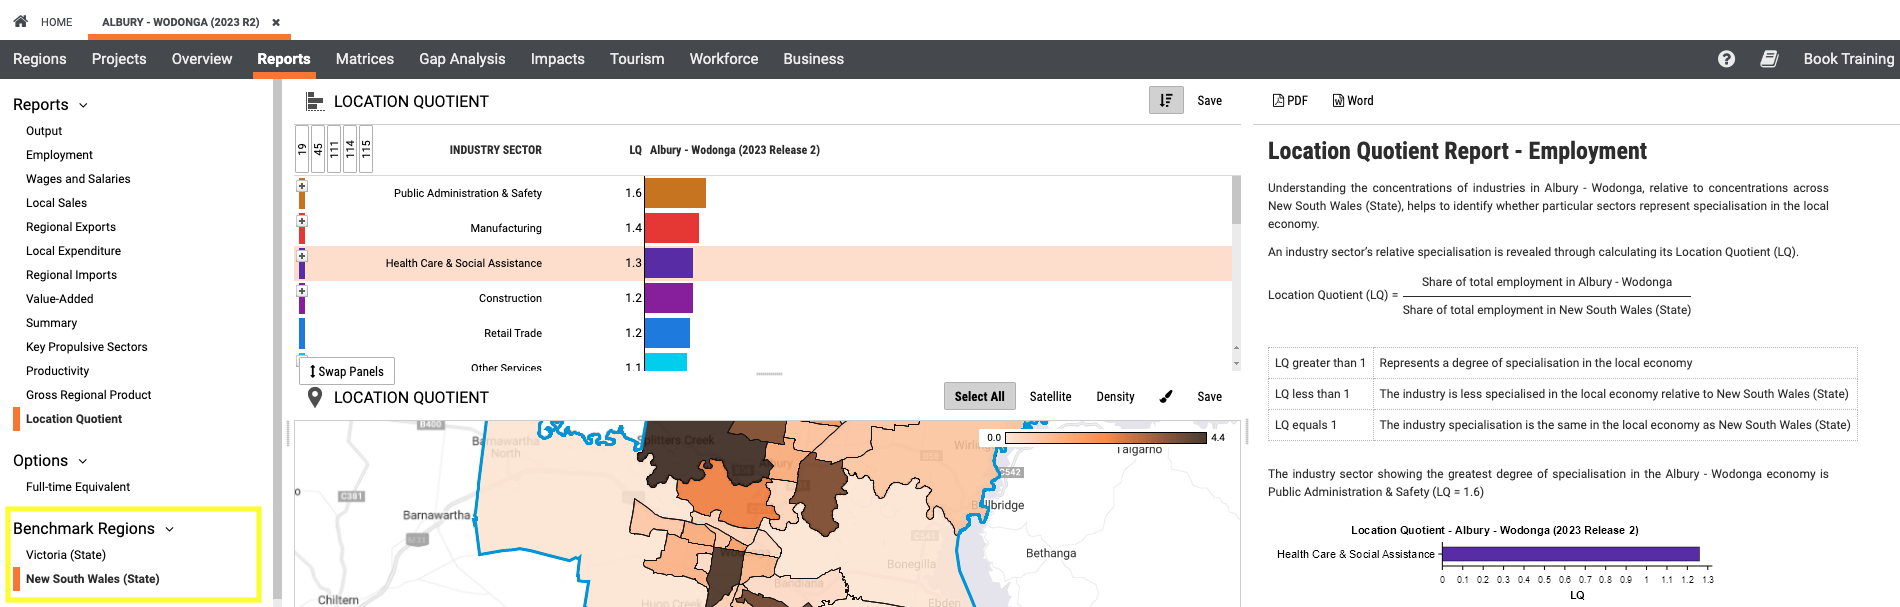
Automatic Benchmarks: For every region, REMPLAN Economy software automatically finds the relevant state for calculating LQs. For regions that straddle state boundaries, the software will present 2 or more state benchmark options.
Figure 7 Albury Wodonga – LQ State Benchmarks
With the introduction of the Location Quotient reporting, it may be timely to schedule a refresher training session for your team.
Training is inclusive for REMPLAN clients and sessions can be arranged via the ‘Book Training’ link in the software
Alternatively, please contact us directly to arrange a time:
Please call us on 1300 737 443 or contact us online.

No Comments