28 Mar JobSeeker data provides another perspective on unemployment
The COVID-19 pandemic has changed our lives in many ways and a key economic and social impact has been on employment. Travel restrictions and social distancing have fundamentally changed some industries forever. The impacts have been uneven across the economy and REMPLAN has already developed COVID-19 tools to provide the evidence for understanding these.
In the initial stages of the pandemic, economists made many dire predictions about the number of unemployed people that would result through COVID-19 restrictions and lockdowns. By and large, the numbers released by the ABS through the Labour Force Survey have shown an increase in unemployment, but not to the levels predicted. In March 2020, the unemployment rate in Australia was 5.6%, and increased to 7.4% in July. In terms of numbers, there were 765,400 unemployed persons in March 2020, and this increased to 995,100 in July 2020. The latest data (January 2021) shows an unemployment rate of 6.9%, and 940,800 unemployed persons.
So why didn’t the predictions of dire numbers eventuate? Australia has been lucky to escape the worst impacts of the pandemic, but from a data perspective part of the answer lies in the treatment of JobKeeper recipients in the labour force survey. The ABS explains that they are still treated as employed, even if they are not working any hours. For all intents and purposes, these people are not actively employed as they are not able to perform their normal job, but instead are being paid via a government subsidy.
JobSeeker data provides a different perspective regarding unemployment. It is a benefit paid to eligible persons aged 22-64 years who are actively seeking employment. The Department of Social Services releases data regularly on the number of recipients of various benefits. This data is available for small areas such as LGAs and SA2s. To this end, REMPLAN has developed a JobSeeker Explorer to provide another insight into the impact of the pandemic, particularly from a spatial perspective. The map below shows the data at December 2020 for LGAs.
The JobSeeker Explorer shows the number of recipients in each area, and also expresses this as a proportion of the population aged 22-64 years. This provides an indication as to the impact of unemployment relative to the working age population.
LGAs with the highest proportion of JobSeeker recipients as a proportion of 22-64 year olds were concentrated in smaller rural and outback communities. Belyuen Shire, a small LGA located in the Northern Territory, recorded the highest proportion (55.7%), followed by Wujal Wujal Aboriginal Shire in northern Queensland (51.0%). In December 2020 there were 21 LGAs where more than one-third of the 22-64 years population was in receipt of JobSeeker.
At the other end of the scale, there were no JobSeeker recipients in Murchison Shire (Western Australia) and in Ashburton Shire it was estimated that just 1.6% of the 22-64 years population was in receipt of JobSeeker. This was followed by the Shire of Kent (1.9%) and Peppermint Grove (2.5%), both also located in Western Australia.
LGAs with larger populations are likely to also record higher numbers of JobSeeker recipients, but it’s also influenced by eligibility, job vacancies and accessibility, as well as the age structure. In December 2020, the LGAs with the highest number of JobSeeker recipients were all located in South East Queensland. This was headed by Brisbane (55,252), followed by Gold Coast (37,837). However the proportion of JobSeeker recipients was estimated to be 6.9% in Brisbane, and 10.3% on the Gold Coast.
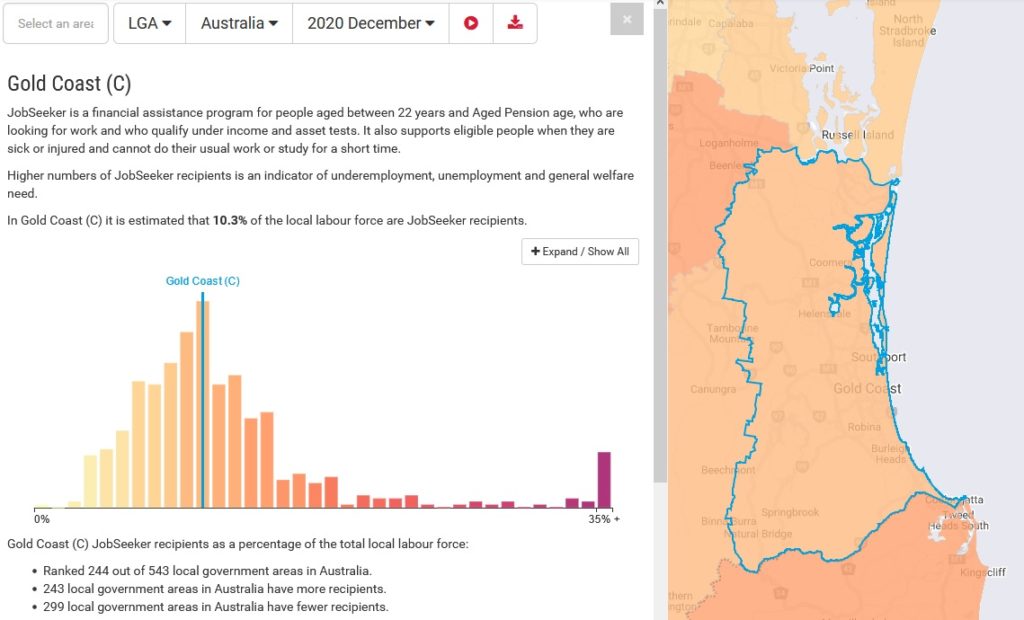
When an area is selected, the JobSeeker Explorer shows where it ranks on a national scale. In the example below, Gold Coast City Council, with 10.3% of the 22-64 year old population receiving JobSeeker, is ranked 244th out of the 543 LGAs in Australia. Selecting the bar also shows that Gold Coast is similar in ranking compared to a large number of other LGAs across the country.
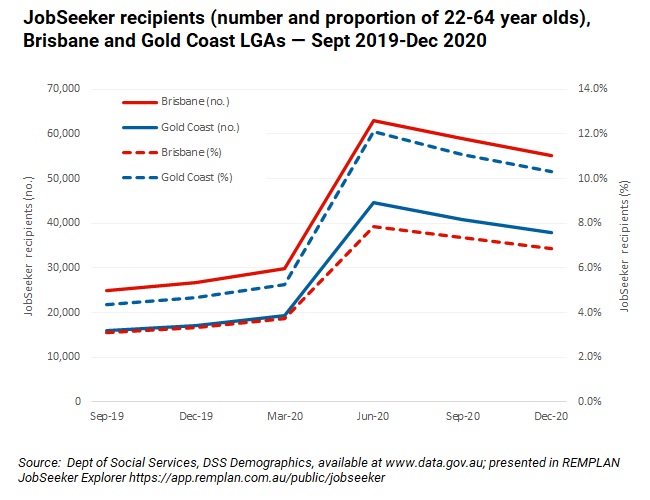
When the data is analysed over time, the change in the number of recipients shows the impact of COVID-19, particularly at the beginning of the pandemic. The chart below uses the Brisbane and Gold Coast LGAs as an example, and this clearly shows the increase in both the number and proportion between the March and June 2020 quarters. In both LGAs the number of JobSeeker recipients more than doubled. The increase was felt more on the Gold Coast due to the structure of the economy, with a higher reliance on the tourism and services sector. For instance, the proportion of 22-64 year olds receiving JobSeeker on the Gold Coast increased from 5.3% in March 2020 to 12.1% in June 2020. It has since softened slightly as the economy has recovered and restrictions have eased, but still hovered just above 10% at December 2020.

Importantly, not everyone is eligible for JobSeeker, so even though this data provides another way of looking at unemployment, it’s highly likely that it understates the total impact. However, using a range of data provides different perspectives on the impacts of COVID-19. This enables users to make more informed judgements with regard to economic recovery strategies and other measures.
The JobSeeker Explorer will be updated each quarter as the data for both LGAs and SA2s is released. It is just one example of the free economic and demographic tools provided by REMPLAN. These can be found on the Data Explorers page on our website.
Please do not hesitate to contact the REMPLAN Team for further information or call us on 1300 737 443.


No Comments