29 Jul Bicycles, the new toilet paper! – Travel Time Analysis

Authored by Matthew Nichol – Principal Economist
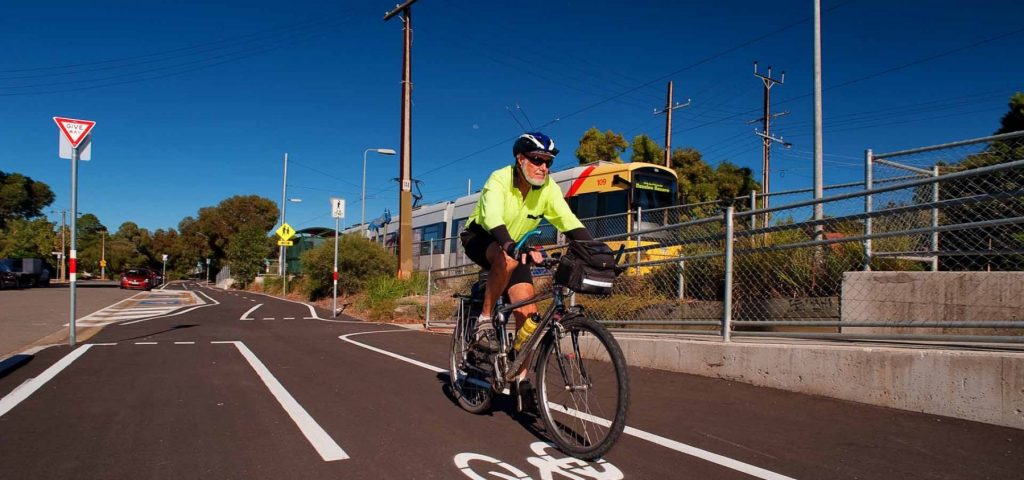
As vehicle traffic has declined across many parts of Australia due to COVID-19, there has been a boom in walking and cycling. Stephen Hodge – former Tour de France cyclist says that in 45 years of riding he has never seen anything like it. Bicycle retailers are struggling to keep up with demand.
As gyms closed, cycling allowed people to excercise while maintaining social distancing and staying close to home. With fewer cars on the road cycling has become safer.
In a COVID-19 world commuters are considering their transport options. New South Wales Premier Gladys Berejiklian says she wants to see public transport use “about only 30 to 40 per cent capacity to ensure social distancing”.
Recent studies by Sydney University’s Institute of Transport and Logistics show the number of people who thought travelling by car was the safest form of transport had grown by 84 per cent. Due to anxiety over hygiene, confidence in travelling on buses and trains was down by 42 per cent and 33 per cent, respectively.
If everyone opts to commute by car our roads will grind to a halt. In this context cycling is presenting as a compelling option for many people, and as a consequence there is now a greater focus on infrastructure such as safe bike paths.
Neighbourhoods and Cities
Over recent years we have observed increasing interest in understanding communities in terms of the accessibility of services within reasonable travel times. Rather than defining communities by administrative boundaries or standard statistical geography, strategic plans are often referring to concepts such as 10-minute neighbourhoods and 30-minute cities. These principles are increasingly influencing how we design our communities and identify suitable sites for infrastructure, community assets and service delivery. Businesses and investors are also seeking resources for rapidly comparing one site with another in terms of:
- Workforce – people with requisite skills
- Demography – characteristics of people in the travel-time catchment
- Market – critical mass of potential customers in target demographic groups
- Competition – potential capacity for growth
- Supply-chains – availability of intermediate goods and services
If there is a sustained shift to walking and cycling then this will have implications for how we define neighbourhoods, cities and service areas. It will also impact site selection for businesses, organisations and service delivery.
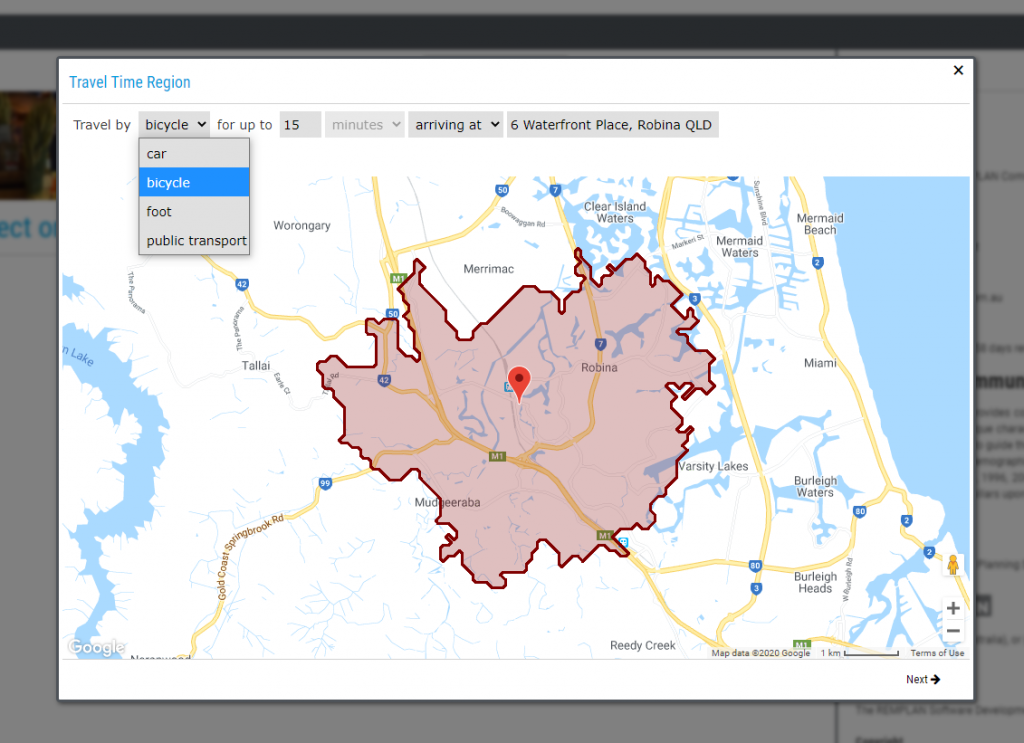
To assist with site analysis, Bicycle and Public Transport options have been added to the Travel Time Analysis feature in REMPLAN Community. This feature allows you to enter an address, specify the mode of transport, and enter the allowed time for travel. The software then automatically generates datasets for these areas based on an isochrone database, like those utilised by satellite navigation systems. It typically requires around five minutes for the dataset to compile and you are then ready to continue with your work!
Here’s how it works.
Under the Regions tab in REMPLAN Community click ‘Create Travel Time region’.
Select the mode of transport, enter the travel time, choose between ‘arriving at’ and ‘departing from’, and finally enter the address.
Click Next.
Name your region. Click Finish.
REMPLAN Community software will start to build your dataset.
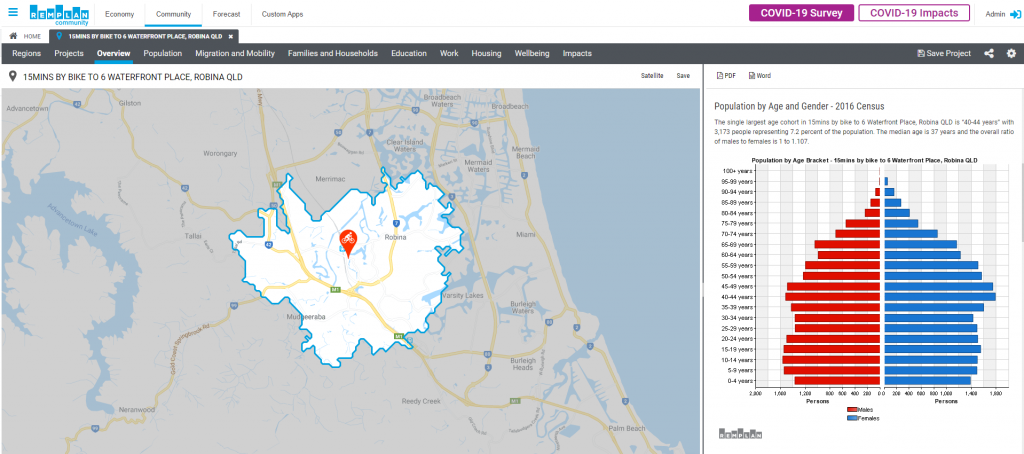
Once complete, you have access to a Community dataset reflecting the unique demography of the area based on the travel time to / from the address you entered.
Under your REMPLAN Community subscription travel time regions can be generated for any address across Australia!
This resource represents a significant time and cost saving for preparing analysis to support site selection, planning and development in your communities..
Contact us to arrange a ZOOM / Teams training session, or demonstration of the Travel Time Analysis feature in REMPLAN Community.
The REMPLAN team


No Comments