20 May New insights to support grant funding submissions and strategy
May 2024 – REMPLAN Economy Update

The Australian Bureau of Statistics (ABS) National Accounts are designed to provide a systematic summary of national economic activity and have been developed to assist in the practical application of economic theory.
The National Accounts Input Output (I-O) tables are updated annually and show the interdependencies between different sectors of the Australian economy. These tables are part of the System of National Accounts (SNA) and are crucial for understanding the flow of goods and services within the economy.
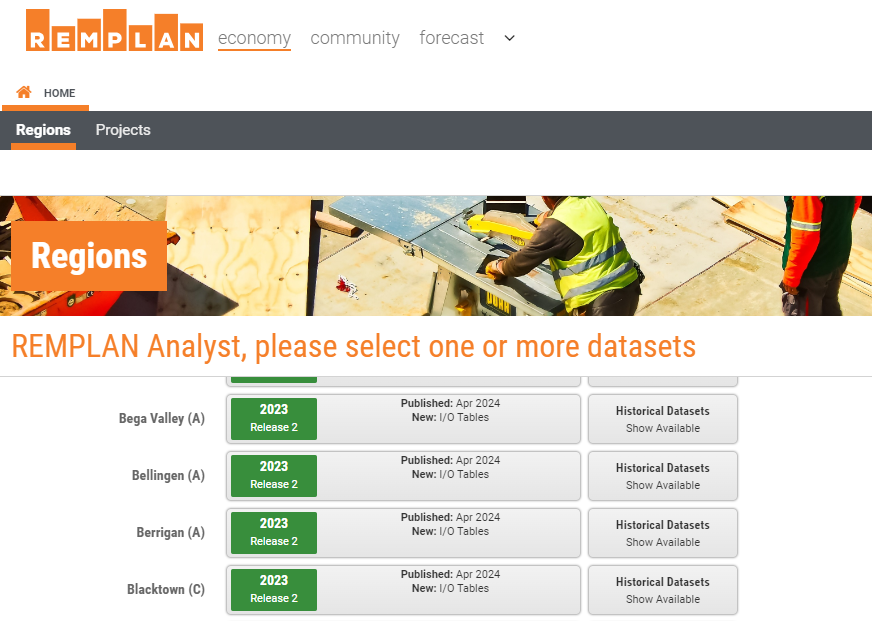
The latest REMPLAN Economy ‘2023 Release 2′ datasets incorporate the ABS’ recently released 115 industry sector 2021 / 2022 National Input Output Tables.
Input-output tables typically consist of three main components:
- Supply Table: This shows the total supply of goods and services, both domestic and imported, available in the economy.
- Use Table: This details how these goods and services are used across different sectors, including intermediate consumption (used in the production of other goods and services) and final consumption (used by end consumers, government, and for exports).
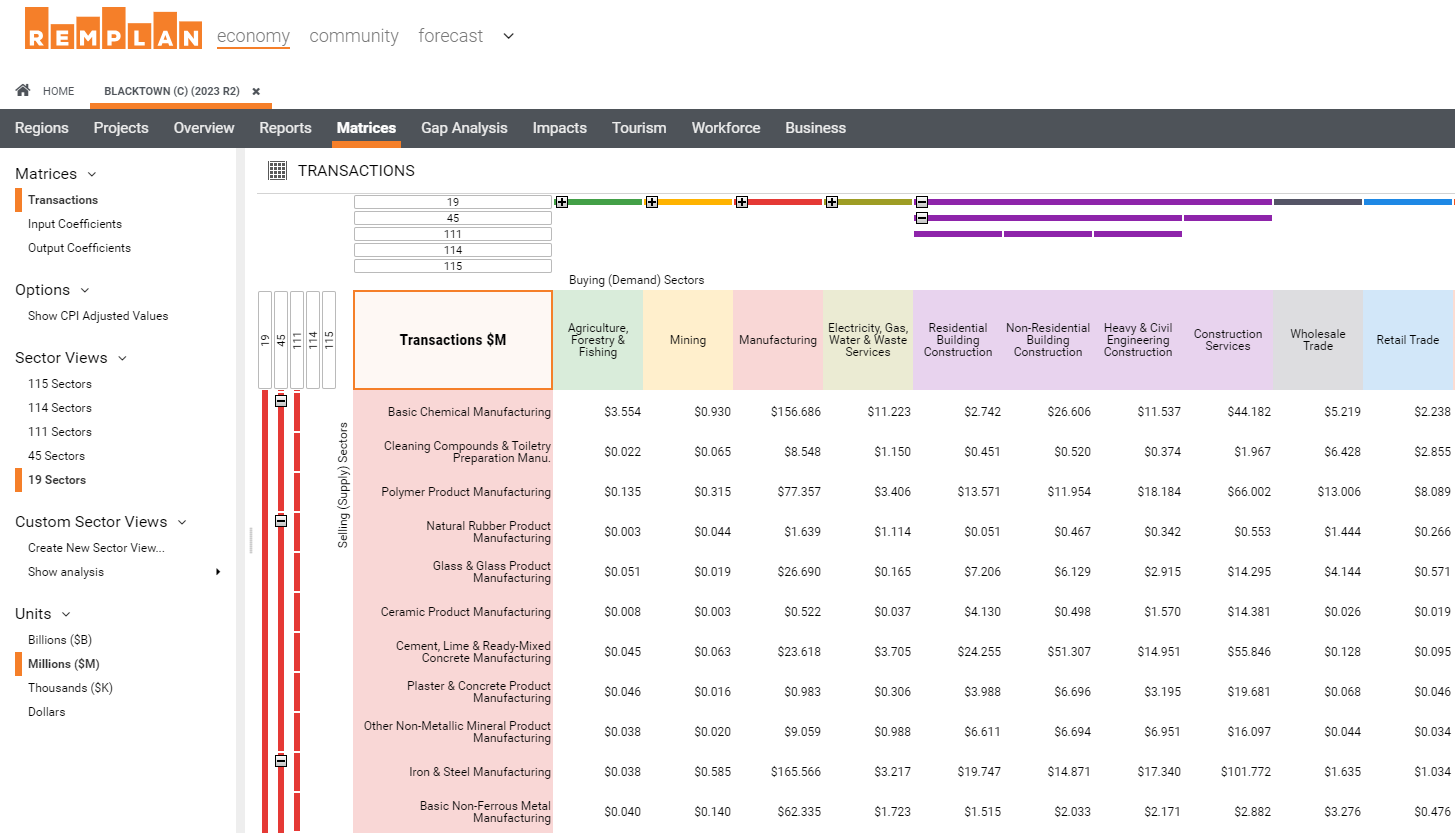
- Symmetric Input-Output Table: This table combines the supply and use tables into a symmetric matrix, showing the direct relationships between the output of one industry and the inputs from other industries.
REMPLAN economic models feature region-specific symmetric input-output tables.
The tables in combination with REMPLAN Economy software are useful for:
- Strategy and Policy: These tables help policymakers and economists understand the structure of the economy, sectoral linkages, and the potential impacts of economic policies. For example, they can analyse how a change in the demand for a product affects different sectors.
- Forecasting and Planning: By examining the interrelationships between sectors, input-output tables can be used to model economic scenarios and forecast future economic activities. This is particularly useful for long-term planning and development strategies.
- Scenario Impact Modellings: They are essential for impact analysis, such as assessing the economic consequences of natural disasters, changes in trade policies, or significant investments in infrastructure. Funding and grant programs typically require that submissions include employment and economic impact analysis.
- Supply Chain Analysis: Businesses can use input-output tables to analyse their supply chains, identify critical suppliers, and assess risks. This is especially useful for managing disruptions and improving efficiency.
In addition to updated supply chain data and impact modelling, the latest REMPLAN Economy Release 2 datasets also present updated reporting on:
- Output
- Wages and salaries
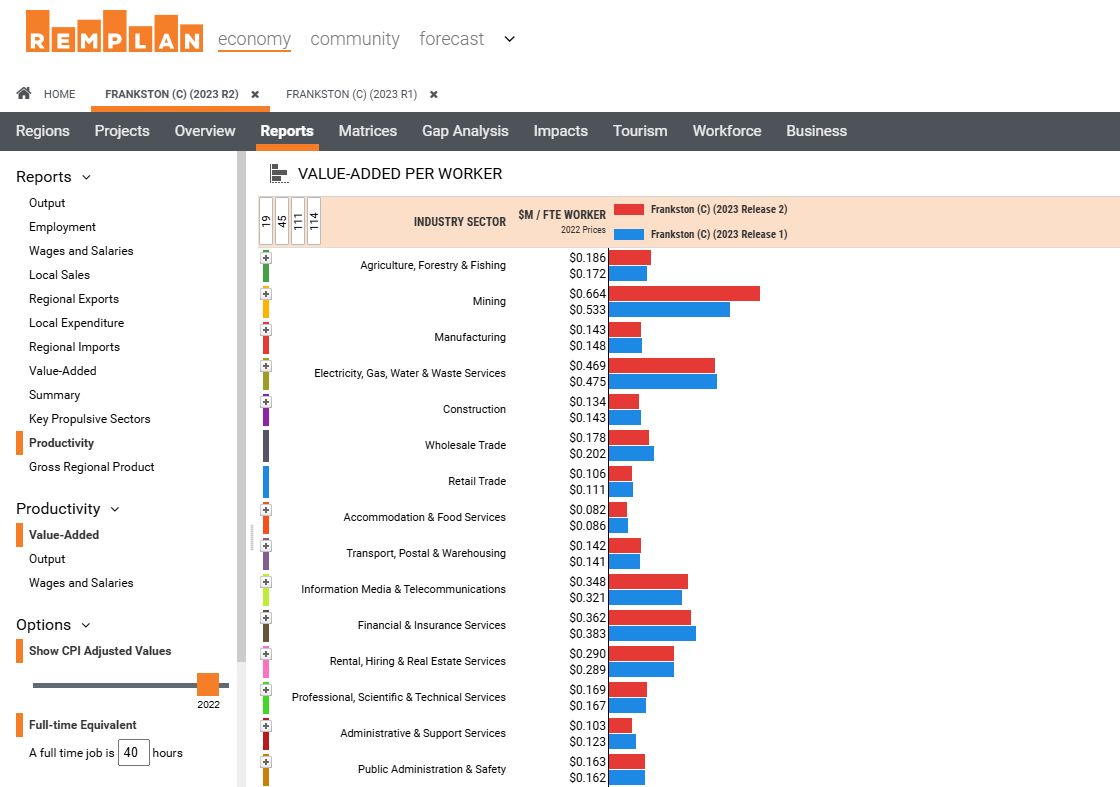
- Worker productivity
- Local sales / expenditure
- Regional exports / imports
- Value-added / Gross Regional Product.
Region-specific Economic Multipliers
Within REMPLAN economic models, the I-O tables define the region-specific buying and selling interactions between industry sectors. This reconciliation between the demand-side (buying) and supply-side (selling) of a local economy is the basis upon which REMPLAN’s region-specific economic multipliers are calculated. These are unique to each region and based on the industry structure of the area, estimated using ABS Place of Work employment data.
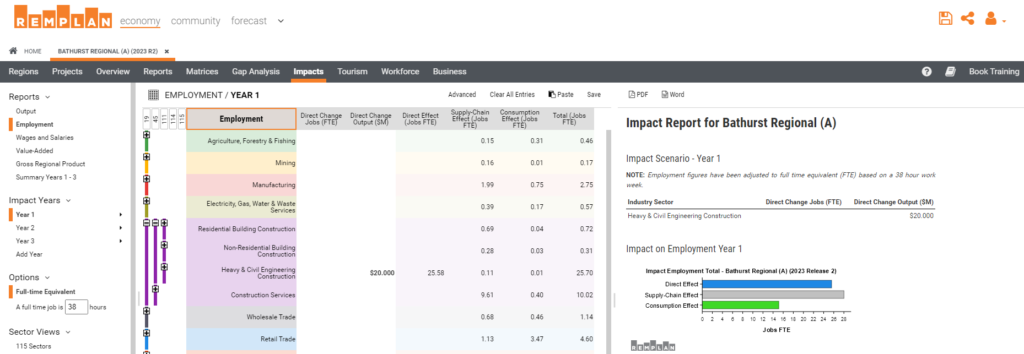
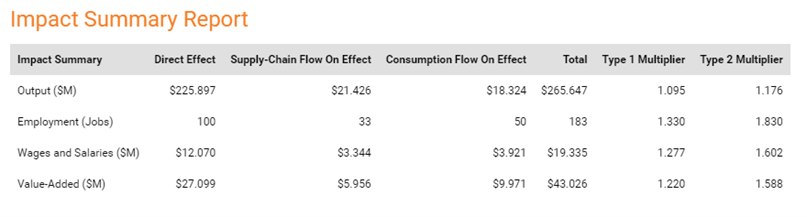
The I-O tables, and the Impacts tab interface in REMPLAN Economy, allow the modelling of flow-on economic impacts from an actual or proposed direct change in the economy. Impact scenarios can be entered as positive or negative changes to direct jobs, or to direct output for each industry sector.
REMPLAN Economy automatically calculates the flow-on supply-chain effects and consumption effects for your direct changes. The flow-on impacts for the region’s economy from a direct change are then summarised as unique region-specific economic multipliers.
…..
Economy Dashboards
Do you need to monitor how your local economy is performing?
Are you required to report regularly on your local economy?
Each time we roll out a REMPLAN update the repository of historical data builds. This is an increasingly valuable resource for understanding how our economies are changing.
With a time series focus, the REMPLAN Economy Dashboard utilises this database.
At the press of a button, the Dashboard generates the latest Economic Insights report.
Example – REMPLAN Economy Dashboard. View here!
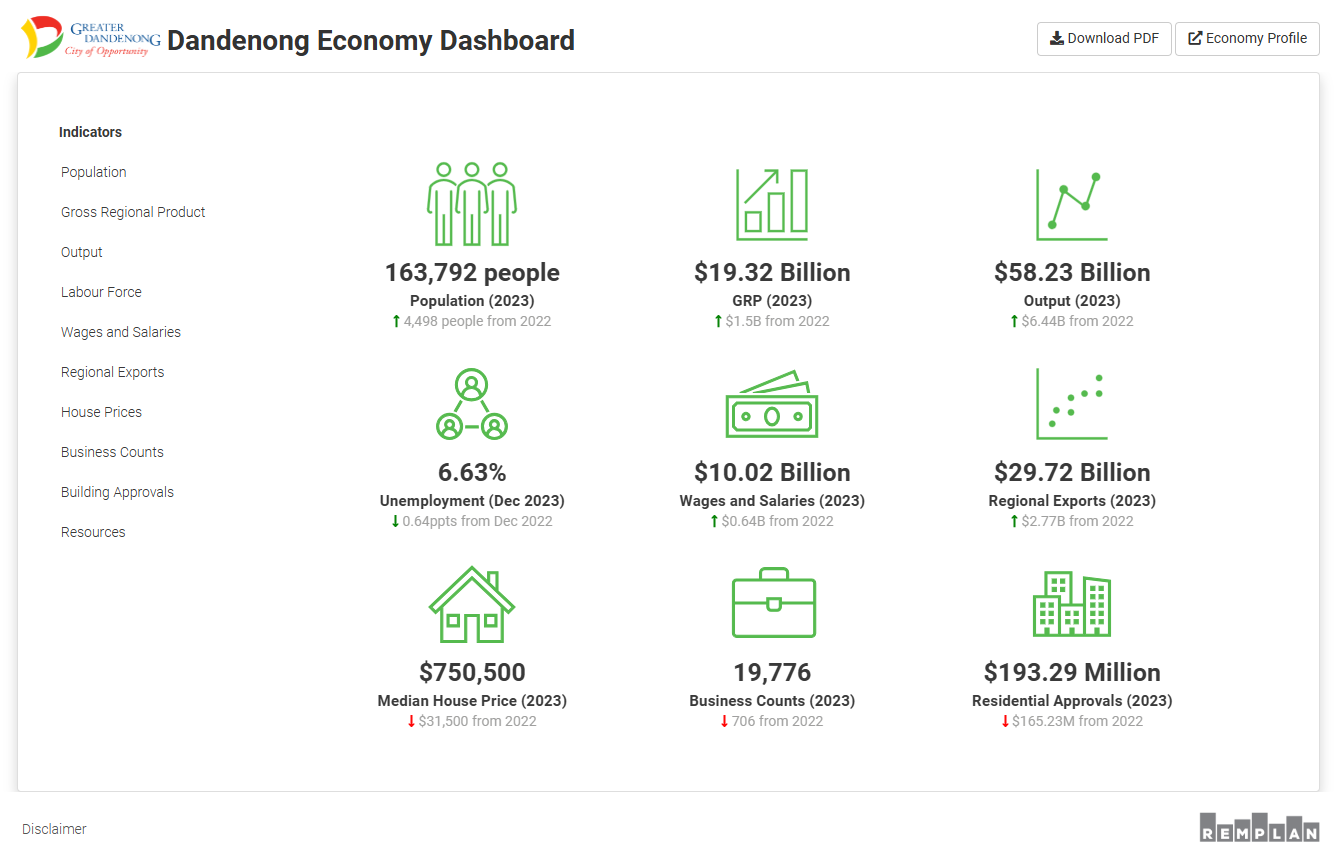
REMPLAN Economy Dashboards deliver an intuitive and accessible interface for data analysis for a wide range of users. By leveraging the REMPLAN Economy Dashboard, localised data that matters most to you and your community becomes easier to monitor, share and report on.
Economy Dashboards can be added to an existing REMPLAN subscription for an annual fee of $2,500 +GST.
Not a REMPLAN subscriber? Please contact us to discuss your requirements.
Please call us on 1300 737 443 or contact us online.

No Comments